Loading... Intro to Seasonality Seasonality in stock market, and $INTC, data refers to recurring patterns and trends that occur at specific times of the year, typically driven by factors such as weather, holidays, or economic cycles. Seasonality Charts and Tables are invaluable tools for investors and traders seeking to identify and leverage these predictable … [Read more...] about Seasonality Analysis for Airbnb Inc ($ABNB)
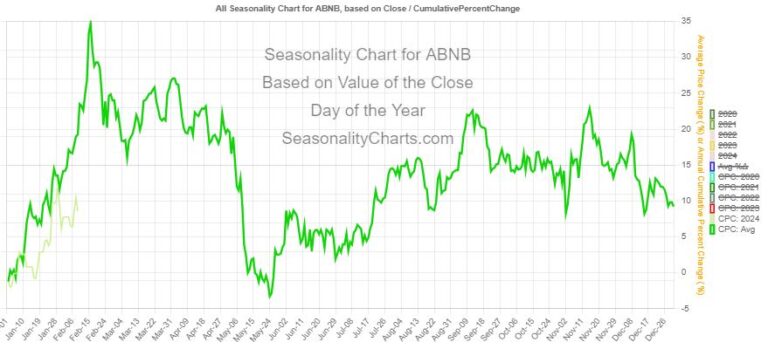
Chart Academy: Mastering Market Analysis
Welcome to Chart Academy, where we transform beginners into market maestros. Dive into our interactive lessons, tutorials, and expert insights designed to elevate your understanding of market charts. From basic interpretations to advanced analytical techniques, Chart Academy is your go-to resource for mastering the art of market analysis.
Seasonality Analysis for Biogen Inc ($BIIB)
Loading... Intro to Seasonality Seasonality in stock market, and $INTC, data refers to recurring patterns and trends that occur at specific times of the year, typically driven by factors such as weather, holidays, or economic cycles. Seasonality Charts and Tables are invaluable tools for investors and traders seeking to identify and leverage these predictable … [Read more...] about Seasonality Analysis for Biogen Inc ($BIIB)
Seasonality Analysis for ON Semiconductor Corp ($ON)
Historical Daily Percent Change Chart โ Stock Market Volatility Analysis This Historical Percent Change Chart tracks the daily percentage fluctuations in stock prices, including Open, High, Low, Close, and Trading Volume. The chart provides a comprehensive view of market volatility, helping traders and analysts identify significant price movements, trend shifts, and market … [Read more...] about Seasonality Analysis for ON Semiconductor Corp ($ON)
Seasonality Analysis for British Petroleum PLC ($BP)
Historical Daily Percent Change Chart โ Stock Market Volatility Analysis This Historical Percent Change Chart tracks the daily percentage fluctuations in stock prices, including Open, High, Low, Close, and Trading Volume. The chart provides a comprehensive view of market volatility, helping traders and analysts identify significant price movements, trend shifts, and market … [Read more...] about Seasonality Analysis for British Petroleum PLC ($BP)
Seasonality Analysis for Snapchat Inc ($SNAP)
Historical Daily Percent Change Chart โ Stock Market Volatility Analysis This Historical Percent Change Chart tracks the daily percentage fluctuations in stock prices, including Open, High, Low, Close, and Trading Volume. The chart provides a comprehensive view of market volatility, helping traders and analysts identify significant price movements, trend shifts, and market … [Read more...] about Seasonality Analysis for Snapchat Inc ($SNAP)