
Free seasonality research for traders and investors
Seasonality charts for stocks, ETFs and indexes
See how every symbol has behaved at each point of the calendar: by date, by week and weekday, and by trading day of the month. Decades of daily data, compounded properly, updated after every session, with plain-English statements of what the patterns say right now.
- 220 symbols
- 15 sectors and asset classes
- up to 56 years of history
- data through Nov 13, 2026
Seasonal outlook for the next four weeks
How each symbol performed over the 20 trading days after November 13 in past years, ranked by how consistently it rose (minimum 10 years of data). History, not a forecast.
Most consistent gains
Seasonality screener
Every symbol at a glance, as of November 13, 2026. Search, filter by sector and sort any column. Averages use complete calendar years; "up" counts the years the period ended higher. Open a symbol for its full charts.
| Typical year | |||||||
|---|---|---|---|---|---|---|---|
| AAPLApple Inc | Technology | +3.0%25/45 up | +0.4%23/45 up | +31.1% | +4.3 pts | 45 | |
| ABBVAbbVie Inc | Healthcare | +6.4%10/13 up | +2.9%9/13 up | +29.1% | +17.3 pts | 13 | |
| ABNBAirbnb Inc | Consumer Discretionary | −0.6%3/5 up | −0.5%3/5 up | +37.6% | +30.5 pts | 5 | |
| ABTAbbott Laboratories | Healthcare | +1.7%36/53 up | +0.3%26/53 up | −13.4% | −25.4 pts | 53 | |
| ACNAccenture plc | Technology | +5.2%20/26 up | +2.8%17/26 up | −6.6% | −15.0 pts | 26 | |
| ADBEAdobe Inc | Technology | +3.3%26/39 up | −0.4%18/39 up | −30.6% | −59.3 pts | 39 | |
| AFRMAffirm Holdings Inc | Financials | +30.8%2/4 up | +15.6%2/4 up | −12.5% | −33.8 pts | 4 | |
| AIC3.ai Inc | Technology | +6.7%2/5 up | +1.2%3/5 up | −12.3% | −5.2 pts | 5 | |
| AMATApplied Materials Inc | Technology | +2.9%30/53 up | +0.7%24/53 up | +44.2% | +15.6 pts | 53 | |
| AMDAdvanced Micro Devices Inc | Technology | +7.4%32/53 up | +1.0%27/53 up | +149.4% | +110.9 pts | 53 | |
| AMGNAmgen Inc | Healthcare | +2.2%26/42 up | +0.7%20/42 up | +42.3% | +20.5 pts | 42 | |
| AMTAmerican Tower Corporation | Real Estate | +7.5%15/27 up | +8.4%12/27 up | +9.2% | −4.8 pts | 27 | |
| AMZNAmazon.com Inc | Technology | +7.7%21/28 up | +8.1%18/28 up | +15.5% | −26.3 pts | 28 | |
| ARKKARK Innovation ETF | ETF | +7.9%8/11 up | +3.9%8/11 up | −2.5% | −22.4 pts | 11 | |
| ARMArm Holdings plc | Technology | −12.6%0/2 up | +1.4%1/2 up | +74.3% | +27.6 pts | 2 | |
| ASMLASML Holding NV | Technology | +4.8%16/30 up | +3.9%22/30 up | +39.8% | +14.0 pts | 30 | |
| AVGOBroadcom Inc | Technology | +5.2%13/16 up | +6.5%14/16 up | +5.3% | −25.1 pts | 16 | |
| AXPAmerican Express Company | Financials | +3.0%34/53 up | +0.3%28/53 up | −13.3% | −25.1 pts | 53 | |
| BAThe Boeing Company | Industrials | +3.6%34/53 up | +2.3%35/53 up | −21.0% | −33.6 pts | 53 | |
| BABAAlibaba Group Holding Ltd | Consumer Discretionary | −1.1%4/11 up | −0.5%4/11 up | −35.6% | −51.1 pts | 11 | |
| BACBank of America Corp | Financials | +2.1%31/53 up | −0.6%29/53 up | −8.2% | −17.8 pts | 53 | |
| BKNGBooking Holdings Inc | Consumer Discretionary | +2.0%14/26 up | +1.2%16/26 up | −25.5% | −62.2 pts | 26 | |
| BLKBlackRock Inc | Financials | +3.8%18/26 up | +2.1%18/26 up | +14.3% | −3.3 pts | 26 | |
| BMYBristol-Myers Squibb Company | Healthcare | +2.0%33/53 up | +1.5%36/53 up | +15.5% | +9.6 pts | 53 | |
| BNDVanguard Total Bond Market ETF | Bond | +0.6%11/18 up | +0.4%10/18 up | −4.7% | −4.3 pts | 18 | |
| BNOUnited States Brent Oil Fund | Commodity | −2.5%7/15 up | −2.4%7/15 up | +115.6% | +110.1 pts | 15 | |
| BNTXBioNTech SE | Healthcare | +17.4%5/6 up | +8.2%5/6 up | −10.7% | −63.5 pts | 6 | |
| BNYBank of New York Mellon Corp | Financials | +2.9%32/53 up | −0.3%29/53 up | +32.2% | +22.4 pts | 53 | |
| BPBP plc | Energy | −0.1%17/41 up | −0.2%19/41 up | +31.9% | +27.9 pts | 41 | |
| CCitigroup Inc | Financials | +2.0%23/39 up | +2.1%23/39 up | +6.3% | −3.2 pts | 39 | |
| CATCaterpillar Inc | Industrials | +4.3%37/53 up | +1.5%34/53 up | +5.7% | −5.1 pts | 53 | |
| CCJCameco Corporation | Energy | +4.5%20/29 up | +3.7%19/29 up | −22.7% | −31.7 pts | 29 | |
| CMCSAComcast Corporation | Communication Services | +5.3%28/52 up | +4.6%31/52 up | −10.1% | −36.3 pts | 52 | |
| CMGChipotle Mexican Grill Inc | Consumer Discretionary | +4.4%13/19 up | +4.5%12/19 up | −4.7% | −35.9 pts | 19 | |
| COINCoinbase Global Inc | Financials | +18.8%2/4 up | +2.4%1/4 up | −42.2% | −90.0 pts | 4 | |
| CORNTeucrium Corn Fund | Commodity | −1.7%3/15 up | −0.5%7/15 up | −3.1% | +0.5 pts | 15 | |
| COSTCostco Wholesale Corporation | Consumer Staples | +4.3%32/43 up | +0.5%22/43 up | +26.7% | +11.5 pts | 43 | |
| CPERUnited States Copper Index Fund | Commodity | +2.0%8/14 up | +1.8%9/14 up | +4.5% | +2.9 pts | 14 | |
| CRMSalesforce Inc | Technology | +3.5%12/21 up | +2.6%10/21 up | −17.9% | −44.5 pts | 21 | |
| CRWDCrowdStrike Holdings Inc | Technology | +3.0%3/6 up | +1.4%3/6 up | +93.4% | +34.9 pts | 6 | |
| CSCOCisco Systems Inc | Technology | +5.3%23/35 up | +3.6%24/35 up | +32.4% | +9.4 pts | 35 | |
| CVNACarvana Co | Consumer Discretionary | +7.1%6/8 up | +4.6%5/8 up | −14.3% | −169.1 pts | 8 | |
| CVSCVS Health Corporation | Healthcare | +0.9%27/53 up | −0.1%30/53 up | +13.1% | +1.5 pts | 53 | |
| CVXChevron Corporation | Energy | +0.5%30/56 up | +1.1%31/56 up | +42.0% | +35.0 pts | 56 | |
| DASHDoorDash Inc | Consumer Discretionary | +8.8%3/5 up | −3.1%3/5 up | −24.3% | −62.8 pts | 5 | |
| DBAInvesco DB Agriculture Fund | Commodity | +0.2%9/19 up | +0.5%11/19 up | +4.0% | +4.1 pts | 19 | |
| DBCInvesco DB Commodity Index Tracking Fund | Commodity | −1.4%7/19 up | −1.4%8/19 up | +37.7% | +35.4 pts | 19 | |
| DDOGDatadog Inc | Technology | +12.2%4/6 up | +1.6%3/6 up | +35.4% | −5.8 pts | 6 | |
| DEDeere & Company | Industrials | +5.4%38/53 up | +1.9%32/53 up | +44.7% | +36.6 pts | 53 | |
| DIASPDR Dow Jones Industrial Average ETF | ETF | +2.6%21/27 up | +1.4%21/27 up | +8.9% | +3.4 pts | 27 | |
| DISThe Walt Disney Company | Consumer Discretionary | +2.7%36/53 up | +2.3%32/53 up | +3.9% | −5.1 pts | 53 | |
| DJIDow Jones Industrial Average | Index | +1.9%40/56 up | +1.1%38/56 up | +8.9% | +2.8 pts | 56 | |
| DOCUDocuSign Inc | Technology | +3.8%4/7 up | +4.3%6/7 up | +18.1% | −8.6 pts | 7 | |
| DUKDuke Energy Corporation | Utilities | −0.8%24/53 up | +0.4%28/53 up | +10.2% | +5.3 pts | 53 | |
| EEMiShares MSCI Emerging Markets ETF | ETF | +1.3%9/22 up | +0.7%16/22 up | +11.4% | +4.6 pts | 22 | |
| EFAiShares MSCI EAFE ETF | ETF | +1.6%15/23 up | +1.1%15/23 up | +8.5% | +3.4 pts | 23 | |
| ENPHEnphase Energy Inc | Energy | +8.0%8/13 up | +10.3%11/13 up | −18.7% | −84.3 pts | 13 | |
| EWJiShares MSCI Japan ETF | ETF | +1.0%18/29 up | +1.2%17/29 up | +13.7% | +11.7 pts | 29 | |
| EXPEExpedia Group Inc | Consumer Discretionary | +5.1%11/20 up | +4.3%12/20 up | −7.9% | −27.6 pts | 20 | |
| FFord Motor Company | Consumer Discretionary | +2.0%30/53 up | +1.4%28/53 up | −9.3% | −19.6 pts | 53 | |
| FDXFedEx Corporation | Industrials | +4.0%33/47 up | +0.8%27/47 up | +39.4% | +26.1 pts | 47 | |
| FSLRFirst Solar Inc | Energy | +3.2%11/19 up | +4.4%11/19 up | −34.4% | −70.3 pts | 19 | |
| FXEInvesco CurrencyShares Euro Trust | Currency | −0.1%11/20 up | +0.6%12/20 up | −6.2% | −5.4 pts | 20 | |
| FXIiShares China Large-Cap ETF | ETF | +2.8%13/21 up | −0.1%10/21 up | −12.6% | −20.0 pts | 21 | |
| FXYInvesco CurrencyShares Japanese Yen Trust | Currency | −0.5%9/18 up | −0.2%10/18 up | −2.2% | −0.6 pts | 18 | |
| GDXVanEck Gold Miners ETF | Commodity | +2.0%10/19 up | +1.1%9/19 up | −4.8% | −13.7 pts | 19 | |
| GDXJVanEck Junior Gold Miners ETF | Commodity | −0.3%5/16 up | −1.0%7/16 up | −13.0% | −22.5 pts | 16 | |
| GEGE Aerospace | Industrials | +2.5%35/56 up | +1.2%34/56 up | +7.4% | −3.9 pts | 56 | |
| GILDGilead Sciences Inc | Healthcare | +3.5%21/33 up | +1.4%16/33 up | +36.9% | +18.5 pts | 33 | |
| GLDSPDR Gold Shares ETF | ETF | +1.1%11/21 up | +1.3%13/21 up | −10.5% | −21.1 pts | 21 | |
| GMGeneral Motors Company | Consumer Discretionary | +4.9%13/15 up | +1.6%7/15 up | +6.1% | −1.9 pts | 15 | |
| GMEGameStop Corp | Consumer Discretionary | +2.4%13/23 up | −1.4%10/23 up | +28.7% | −27.8 pts | 23 | |
| GOOGAlphabet Inc Class C | Technology | +3.4%8/11 up | +2.7%7/11 up | −6.8% | −33.1 pts | 11 | |
| GOOGLAlphabet Inc Class A | Technology | +1.4%14/21 up | +2.8%16/21 up | −4.6% | −29.4 pts | 21 | |
| GSGoldman Sachs Group Inc | Financials | +2.2%16/26 up | +1.8%18/26 up | +3.9% | −8.2 pts | 26 | |
| HDThe Home Depot Inc | Consumer Discretionary | +5.1%33/44 up | +4.4%29/44 up | +1.3% | −24.0 pts | 44 | |
| HONHoneywell International Inc | Industrials | +2.9%30/41 up | +0.2%19/41 up | +8.8% | −0.2 pts | 41 | |
| HOODRobinhood Markets Inc | Financials | +6.4%1/4 up | +13.3%2/4 up | −31.2% | −115.6 pts | 4 | |
| HYGiShares iBoxx High Yield Corporate Bond ETF | Bond | −0.4%8/18 up | −0.3%10/18 up | −4.6% | −3.0 pts | 18 | |
| IAUiShares Gold Trust | Commodity | +0.9%10/20 up | +0.3%11/20 up | −10.2% | −21.4 pts | 20 | |
| IBBiShares Biotechnology ETF | ETF | +3.5%19/24 up | +1.7%13/24 up | +25.9% | +18.8 pts | 24 | |
| IBMInternational Business Machines | Technology | +2.4%32/53 up | +1.9%36/53 up | −17.4% | −23.3 pts | 53 | |
| IEFiShares 7-10 Year Treasury Bond ETF | Bond | +0.7%15/23 up | +0.6%15/23 up | −6.4% | −6.6 pts | 23 | |
| INOInovio Pharmaceuticals Inc | Healthcare | +0.2%12/27 up | −0.3%10/27 up | −16.1% | −31.9 pts | 27 | |
| INTCIntel Corporation | Technology | +3.1%38/53 up | −0.3%24/53 up | +65.9% | +41.2 pts | 53 | |
| INTUIntuit Inc | Technology | +4.1%21/32 up | +3.2%20/32 up | −48.4% | −67.8 pts | 32 | |
| ISRGIntuitive Surgical Inc | Healthcare | +4.8%20/25 up | +2.8%16/25 up | −21.7% | −54.2 pts | 25 | |
| IVViShares Core S&P 500 ETF | ETF | +2.8%20/25 up | +1.2%17/25 up | +10.6% | +3.8 pts | 25 | |
| IWMiShares Russell 2000 ETF | ETF | +3.6%21/25 up | +1.8%15/25 up | +12.8% | +7.0 pts | 25 | |
| IXICNasdaq Composite Index | Index | +2.1%39/54 up | +0.8%32/54 up | +8.2% | −2.5 pts | 54 | |
| JEPIJPMorgan Equity Premium Income ETF | ETF | +2.2%4/5 up | +1.2%4/5 up | +1.3% | +0.3 pts | 5 | |
| JNJJohnson & Johnson | Healthcare | +1.6%34/56 up | +0.9%32/56 up | +37.0% | +28.0 pts | 56 | |
| JPMJPMorgan Chase & Co | Financials | +1.8%28/53 up | −0.4%27/53 up | +7.4% | −3.4 pts | 53 | |
| KOThe Coca-Cola Company | Consumer Staples | +1.4%32/53 up | +0.8%30/53 up | +42.0% | +34.0 pts | 53 | |
| KRESPDR S&P Regional Banking ETF | ETF | +4.1%13/19 up | +1.1%10/19 up | +12.2% | +10.9 pts | 19 | |
| LCIDLucid Group Inc | Consumer Discretionary | −1.6%2/5 up | −8.3%2/5 up | −72.0% | −98.6 pts | 5 | |
| LEGNLegend Biotech Corp | Healthcare | −5.5%1/5 up | −7.8%1/5 up | −14.7% | −29.6 pts | 5 | |
| LLYEli Lilly and Company | Healthcare | +2.5%38/53 up | +0.5%33/53 up | +34.3% | +24.1 pts | 53 | |
| LMTLockheed Martin Corporation | Industrials | +0.3%16/30 up | +0.2%17/30 up | +23.2% | +13.1 pts | 30 | |
| LOWLowe's Companies Inc | Consumer Discretionary | +4.1%36/53 up | +2.4%29/53 up | −5.6% | −17.8 pts | 53 | |
| LQDiShares iBoxx Investment Grade Corporate Bond ETF | Bond | +0.5%12/23 up | +0.6%14/23 up | −6.7% | −6.1 pts | 23 | |
| LRCXLam Research Corporation | Technology | +5.1%20/41 up | +1.8%21/41 up | +32.0% | −2.0 pts | 41 | |
| LULULululemon Athletica Inc | Consumer Discretionary | +4.0%12/18 up | +6.4%12/18 up | −49.2% | −73.3 pts | 18 | |
| LYFTLyft Inc | Technology | +16.2%4/6 up | −0.0%2/6 up | −12.3% | −15.1 pts | 6 | |
| MAMastercard Inc | Financials | +4.0%13/19 up | +2.4%13/19 up | +15.8% | −8.1 pts | 19 | |
| MARAMARA Holdings Inc | Technology | +29.0%8/13 up | +29.4%7/13 up | −22.2% | −78.0 pts | 13 | |
| MCDMcDonald's Corporation | Consumer Discretionary | +2.2%40/53 up | +0.5%31/53 up | −11.0% | −22.4 pts | 53 | |
| MELIMercadoLibre Inc | Consumer Discretionary | +6.2%10/18 up | +6.7%11/18 up | −26.0% | −57.5 pts | 18 | |
| METAMeta Platforms Inc | Technology | +2.2%8/13 up | +1.8%8/13 up | −5.5% | −42.6 pts | 13 | |
| MMM3M Company | Industrials | +2.4%39/53 up | +0.5%23/53 up | +14.7% | +8.5 pts | 53 | |
| MRKMerck & Co Inc | Healthcare | +3.0%37/53 up | +1.4%31/53 up | +40.4% | +33.4 pts | 53 | |
| MRNAModerna Inc | Healthcare | +20.6%5/7 up | +17.1%6/7 up | +657.4% | +613.6 pts | 7 | |
| MROMarathon Oil Corporation | Energy | +4.3%15/22 up | −0.3%11/22 up | −16.8% | −37.3 pts | 22 | |
| MSMorgan Stanley | Financials | +2.2%23/39 up | +1.1%25/39 up | +7.4% | −7.4 pts | 39 | |
| MSCIMSCI Inc | Financials | +3.7%13/18 up | +2.9%13/18 up | +14.7% | −3.7 pts | 18 | |
| MSFTMicrosoft Corporation | Technology | +1.7%23/39 up | +0.9%25/39 up | +8.1% | −18.4 pts | 39 | |
| MSTRMicroStrategy Inc | Technology | +6.0%16/27 up | +9.5%12/27 up | −26.5% | −71.6 pts | 27 | |
| MUMicron Technology Inc | Technology | +2.6%20/41 up | +2.3%23/41 up | +172.7% | +144.9 pts | 41 | |
| NBISNebius Group NV | Technology | −27.5%0/1 up | −1.1%0/1 up | +38.4% | −181.5 pts | 1 | |
| NDXNasdaq-100 Index | Index | +3.1%23/30 up | +2.2%22/30 up | +10.7% | −3.9 pts | 30 | |
| NEENextEra Energy Inc | Utilities | −0.4%27/53 up | −0.5%25/53 up | +6.0% | −1.5 pts | 53 | |
| NETCloudflare Inc | Technology | +9.6%3/6 up | +5.4%3/6 up | +55.1% | −34.4 pts | 6 | |
| NFLXNetflix Inc | Technology | +1.7%13/23 up | +0.8%12/23 up | −33.1% | −92.3 pts | 23 | |
| NIONIO Inc | Consumer Discretionary | +16.7%3/7 up | −3.0%3/7 up | −43.1% | −161.8 pts | 7 | |
| NKENike Inc | Consumer Discretionary | +2.3%30/45 up | +0.8%28/45 up | −40.4% | −56.7 pts | 45 | |
| NOWServiceNow Inc | Technology | +1.9%6/13 up | +1.0%7/13 up | −33.3% | −65.3 pts | 13 | |
| NVDANVIDIA Corporation | Technology | +7.9%19/26 up | +1.8%14/26 up | −12.7% | −73.2 pts | 26 | |
| ONON Semiconductor Corp | Technology | +9.8%20/25 up | +9.4%18/25 up | +31.2% | +16.8 pts | 25 | |
| ORCLOracle Corporation | Technology | +2.6%24/39 up | +2.3%24/39 up | −35.7% | −65.1 pts | 39 | |
| OXYOccidental Petroleum Corp | Energy | +2.7%30/53 up | −0.3%19/53 up | +42.0% | +32.8 pts | 53 | |
| PANWPalo Alto Networks Inc | Technology | +6.7%7/13 up | +5.5%8/13 up | +74.9% | +50.0 pts | 13 | |
| PATHUiPath Inc | Technology | +7.0%2/4 up | +19.0%4/4 up | −19.0% | −1.5 pts | 4 | |
| PDDPDD Holdings Inc | Consumer Discretionary | +11.2%3/7 up | −1.1%2/7 up | −30.4% | −87.7 pts | 7 | |
| PEPPepsiCo Inc | Consumer Staples | +0.8%32/53 up | +0.1%28/53 up | +1.3% | −8.6 pts | 53 | |
| PFEPfizer Inc | Healthcare | +2.5%35/53 up | +0.6%31/53 up | +16.0% | +9.3 pts | 53 | |
| PGProcter & Gamble Co | Consumer Staples | +2.2%34/53 up | +1.0%34/53 up | +18.5% | +12.0 pts | 53 | |
| PINSPinterest Inc | Technology | +0.0%3/6 up | +0.4%3/6 up | −26.0% | −55.0 pts | 6 | |
| PLDPrologis Inc | Real Estate | +1.3%21/28 up | +2.9%19/28 up | +0.8% | −4.8 pts | 28 | |
| PLTRPalantir Technologies Inc | Technology | +9.2%2/5 up | −3.9%2/5 up | −3.5% | −111.8 pts | 5 | |
| PPLTabrdn Physical Platinum Shares ETF | Commodity | −1.3%5/15 up | +0.1%6/15 up | −27.6% | −28.2 pts | 15 | |
| PYPLPayPal Holdings Inc | Financials | +0.4%6/10 up | −0.2%5/10 up | +1.5% | −12.5 pts | 10 | |
| QCOMQualcomm Inc | Technology | +7.1%23/34 up | −0.6%16/34 up | +0.8% | −54.9 pts | 34 | |
| QQQInvesco QQQ Trust | ETF | +2.3%19/26 up | +1.6%19/26 up | +10.7% | +0.2 pts | 26 | |
| QQQMInvesco Nasdaq 100 ETF | ETF | +4.4%4/5 up | +1.6%3/5 up | +10.7% | −6.1 pts | 5 | |
| RBLXRoblox Corporation | Technology | −6.2%1/4 up | −0.8%2/4 up | −36.5% | −54.0 pts | 4 | |
| RDDTReddit Inc | Technology | +3.6%1/1 up | +18.7%1/1 up | −57.2% | −73.1 pts | 1 | |
| RENTRent the Runway Inc | Consumer Discretionary | +3.9%3/4 up | +45.2%3/4 up | −71.3% | −19.2 pts | 4 | |
| RIOTRiot Platforms Inc | Technology | +15.6%12/22 up | +20.8%12/22 up | +38.3% | +17.2 pts | 22 | |
| RIVNRivian Automotive Inc | Consumer Discretionary | +10.1%3/4 up | +4.1%3/4 up | −38.2% | −12.2 pts | 4 | |
| ROKURoku Inc | Technology | +10.3%5/8 up | +2.7%5/8 up | +48.0% | −12.9 pts | 8 | |
| RTXRTX Corporation | Industrials | +1.7%32/53 up | −0.3%31/53 up | +8.3% | +1.1 pts | 53 | |
| RUTRussell 2000 Index | Index | +2.7%16/21 up | +1.4%11/21 up | +12.4% | +7.1 pts | 21 | |
| SBUXStarbucks Corporation | Consumer Discretionary | +2.9%25/33 up | +1.2%19/33 up | +26.4% | +5.5 pts | 33 | |
| SCHDSchwab US Dividend Equity ETF | ETF | +3.7%13/14 up | +1.1%9/14 up | +31.7% | +23.9 pts | 14 | |
| SCHWCharles Schwab Corporation | Financials | +4.2%21/38 up | +3.0%24/38 up | −8.2% | −30.1 pts | 38 | |
| SHOPShopify Inc | Technology | +15.7%9/10 up | +11.9%10/10 up | −8.9% | −65.0 pts | 10 | |
| SHYiShares 1-3 Year Treasury Bond ETF | Bond | +0.1%12/23 up | +0.0%13/23 up | −2.0% | −2.0 pts | 23 | |
| SLBSLB (Schlumberger) | Energy | +0.7%26/53 up | −0.7%23/53 up | +34.6% | +24.9 pts | 53 | |
| SLViShares Silver Trust ETF | ETF | +0.9%7/19 up | +1.4%10/19 up | −31.5% | −41.9 pts | 19 | |
| SMCISuper Micro Computer Inc | Technology | +6.1%13/18 up | +14.4%12/18 up | −8.2% | −32.1 pts | 18 | |
| SMHVanEck Semiconductor ETF | ETF | +5.2%19/25 up | +1.7%14/25 up | +35.2% | +19.6 pts | 25 | |
| SNAPSnap Inc | Technology | +5.1%4/8 up | +2.7%3/8 up | −35.3% | −55.6 pts | 8 | |
| SNOWSnowflake Inc | Technology | +11.7%2/5 up | +4.6%2/5 up | +32.7% | +27.3 pts | 5 | |
| SOSouthern Company | Utilities | +0.2%29/53 up | +0.5%31/53 up | +7.3% | +3.4 pts | 53 | |
| SOFISoFi Technologies Inc | Financials | +3.6%2/5 up | −6.9%2/5 up | −41.1% | −79.8 pts | 5 | |
| SOUNSoundHound AI Inc | Technology | +29.4%2/3 up | +37.5%1/3 up | −65.0% | −121.6 pts | 3 | |
| SOXXiShares Semiconductor ETF | ETF | +5.3%19/25 up | +2.3%18/25 up | +48.7% | +14.8 pts | 25 | |
| SOYBTeucrium Soybean Fund | Commodity | +0.6%8/14 up | +0.2%7/14 up | +18.8% | +18.1 pts | 14 | |
| SPGIS&P Global Inc | Financials | +1.2%30/53 up | +0.1%26/53 up | −4.2% | −17.8 pts | 53 | |
| SPOTSpotify Technology SA | Technology | +4.1%3/7 up | +2.0%4/7 up | +5.5% | −42.2 pts | 7 | |
| SPXS&P 500 Index | Index | +2.3%23/29 up | +1.7%24/29 up | +10.9% | +4.1 pts | 29 | |
| SPYSPDR S&P 500 ETF Trust | ETF | +2.6%25/32 up | +1.3%23/32 up | +10.6% | +2.3 pts | 32 | |
| SQQQProShares UltraPro Short QQQ ETF | ETF | −9.5%2/15 up | −5.0%3/15 up | −40.3% | +3.8 pts | 15 | |
| TAT&T Inc | Communication Services | +1.1%22/41 up | +2.1%29/41 up | −10.7% | −13.7 pts | 41 | |
| TGTTarget Corporation | Consumer Staples | +2.4%29/53 up | +0.1%25/53 up | +65.2% | +48.5 pts | 53 | |
| TIPiShares TIPS Bond ETF | Bond | +0.4%14/22 up | −0.0%9/22 up | −4.8% | −5.3 pts | 22 | |
| TLTiShares 20+ Year Treasury Bond ETF | Bond | +1.4%15/23 up | +2.0%16/23 up | −8.9% | −7.9 pts | 23 | |
| TMOThermo Fisher Scientific Inc | Healthcare | +2.3%27/53 up | −0.1%29/53 up | +20.8% | +6.1 pts | 53 | |
| TMUST-Mobile US Inc | Communication Services | +2.9%9/18 up | +1.4%7/18 up | −16.3% | −27.2 pts | 18 | |
| TQQQProShares UltraPro QQQ ETF | ETF | +8.6%12/15 up | +3.8%10/15 up | +9.4% | −39.6 pts | 15 | |
| TSLATesla Inc | Consumer Discretionary | +7.2%10/15 up | +5.7%11/15 up | −11.6% | −74.4 pts | 15 | |
| TSMTaiwan Semiconductor Manufacturing Co | Technology | +3.9%17/28 up | +2.6%17/28 up | +31.2% | +7.0 pts | 28 | |
| TTDThe Trade Desk Inc | Technology | +11.2%5/9 up | +5.6%6/9 up | −58.7% | −118.0 pts | 9 | |
| TWLOTwilio Inc | Technology | +5.2%5/9 up | +5.7%5/9 up | +48.5% | +2.1 pts | 9 | |
| TXNTexas Instruments Inc | Technology | +3.3%32/53 up | +1.6%32/53 up | +75.0% | +62.2 pts | 53 | |
| UUnity Software Inc | Technology | +19.3%5/5 up | +10.7%4/5 up | +19.6% | +27.3 pts | 5 | |
| UBERUber Technologies Inc | Technology | +11.0%3/6 up | −3.5%2/6 up | −14.7% | −47.6 pts | 6 | |
| UNGUnited States Natural Gas Fund | Commodity | −1.8%8/18 up | −6.2%7/18 up | −17.2% | −4.1 pts | 18 | |
| UNHUnitedHealth Group Inc | Healthcare | +3.8%29/41 up | +2.9%30/41 up | +23.4% | −1.0 pts | 41 | |
| UNPUnion Pacific Corporation | Industrials | +2.9%35/53 up | −0.3%29/53 up | +30.8% | +20.0 pts | 53 | |
| UPSUnited Parcel Service Inc | Industrials | +4.2%20/26 up | +1.3%18/26 up | +13.3% | +10.9 pts | 26 | |
| UPSTUpstart Holdings Inc | Financials | +3.2%2/5 up | +8.6%3/5 up | −55.3% | −166.3 pts | 5 | |
| URAGlobal X Uranium ETF | Commodity | +0.8%9/15 up | +0.3%8/15 up | −25.5% | −27.3 pts | 15 | |
| USOUnited States Oil Fund | Commodity | −3.2%7/19 up | −3.2%9/19 up | +110.5% | +111.4 pts | 19 | |
| UUPInvesco DB US Dollar Index Bullish Fund | Currency | +0.4%11/18 up | −0.4%8/18 up | +9.1% | +6.7 pts | 18 | |
| VVisa Inc | Financials | +3.3%13/17 up | +1.8%12/17 up | +21.4% | +1.8 pts | 17 | |
| VIGVanguard Dividend Appreciation ETF | ETF | +2.9%16/19 up | +1.2%13/19 up | +14.6% | +7.4 pts | 19 | |
| VIXCboe Volatility Index | Index | −6.5%6/21 up | −0.5%7/21 up | +25.1% | +8.2 pts | 21 | |
| VOOVanguard S&P 500 ETF | ETF | +3.3%13/15 up | +1.3%10/15 up | +10.6% | −0.6 pts | 15 | |
| VTIVanguard Total Stock Market ETF | ETF | +2.6%20/24 up | +1.3%15/24 up | +10.7% | +2.9 pts | 24 | |
| VWOVanguard FTSE Emerging Markets ETF | ETF | +0.8%8/20 up | +0.1%11/20 up | +4.9% | −1.0 pts | 20 | |
| VZVerizon Communications Inc | Communication Services | +1.4%23/42 up | +2.5%26/42 up | +13.8% | +10.9 pts | 42 | |
| WEATTeucrium Wheat Fund | Commodity | −2.2%4/14 up | −1.6%4/14 up | +9.5% | +17.6 pts | 14 | |
| WFCWells Fargo & Company | Financials | +1.9%31/53 up | +0.2%26/53 up | −8.0% | −17.1 pts | 53 | |
| WMTWalmart Inc | Consumer Staples | +4.4%35/53 up | +2.2%24/53 up | +15.0% | −4.1 pts | 53 | |
| XBISPDR S&P Biotech ETF | ETF | +5.0%14/19 up | +2.2%13/19 up | +23.5% | +2.2 pts | 19 | |
| XLBMaterials Select Sector SPDR Fund | ETF | +3.8%22/26 up | +1.5%18/26 up | +15.2% | +10.9 pts | 26 | |
| XLCCommunication Services Select Sector SPDR Fund | ETF | +4.3%6/7 up | +1.8%5/7 up | −7.7% | −24.9 pts | 7 | |
| XLEEnergy Select Sector SPDR ETF | ETF | +1.8%16/27 up | +0.3%13/27 up | +45.3% | +37.8 pts | 27 | |
| XLFFinancial Select Sector SPDR ETF | ETF | +3.1%19/28 up | +1.0%16/28 up | +7.1% | +3.9 pts | 28 | |
| XLIIndustrial Select Sector SPDR Fund | ETF | +3.5%21/27 up | +1.6%19/27 up | +8.8% | +2.3 pts | 27 | |
| XLKTechnology Select Sector SPDR ETF | ETF | +2.7%20/27 up | +2.4%23/27 up | +20.7% | +10.4 pts | 27 | |
| XLPConsumer Staples Select Sector SPDR Fund | ETF | +2.0%20/27 up | +1.1%18/27 up | +18.9% | +15.3 pts | 27 | |
| XLREReal Estate Select Sector SPDR Fund | ETF | +3.5%7/10 up | +1.4%4/10 up | +10.0% | +6.7 pts | 10 | |
| XLUUtilities Select Sector SPDR Fund | ETF | +0.9%16/26 up | +1.3%14/26 up | +3.2% | −1.3 pts | 26 | |
| XLVHealth Care Select Sector SPDR Fund | ETF | +2.4%21/27 up | +1.7%22/27 up | +22.0% | +16.5 pts | 27 | |
| XLYConsumer Discretionary Select Sector SPDR Fund | ETF | +2.9%20/27 up | +2.1%21/27 up | +0.5% | −7.5 pts | 27 | |
| XOMExxon Mobil Corporation | Energy | +0.5%26/53 up | +0.9%31/53 up | +41.1% | +33.1 pts | 53 | |
| XYZBlock Inc | Technology | +12.8%7/10 up | +4.5%6/10 up | +29.9% | −10.1 pts | 10 | |
| ZSZscaler Inc | Technology | +6.2%5/7 up | +1.0%3/7 up | −14.4% | −63.3 pts | 7 |
No symbol matches that search.
How to read seasonality
Each symbol page measures the same question three ways. A pattern that shows up in all three is more robust than one that appears in only one.
Same date, every year
Year-to-date returns lined up on the calendar. Reveals date-anchored effects such as year-end tax selling, the January effect and earnings seasons.
Week and weekday
Sessions aligned by week number and weekday, so week 14 lines up across years. Shows weekday tendencies and how they drift through the year.
Trading day of the month
Sessions numbered 1, 2, 3… within each month. Brings out flow-driven moves around the turn of the month and options expiry.
Start with an example: Apple (AAPL) seasonality, or read the disclaimer on what seasonality can and cannot tell you.
Latest research
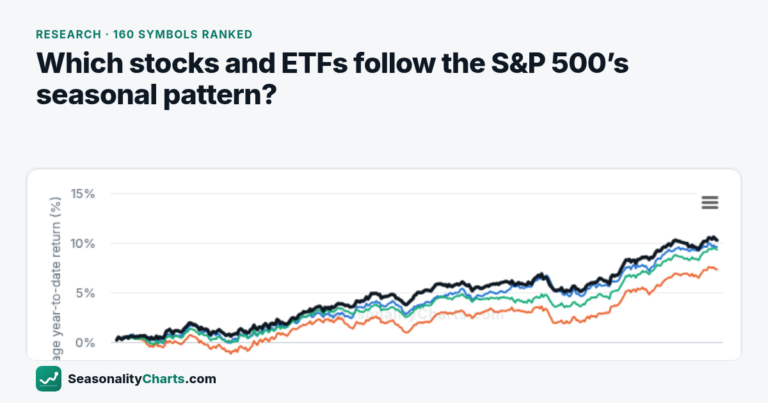
Which Stocks and ETFs Follow the S&P 500’s Seasonal Pattern? We Ranked 160 Symbols
We compared the seasonal pattern of 160 stocks, ETFs and indexes with SPY over the same years. Industrials and big banks follow the S&P 500’s calendar…
Read the article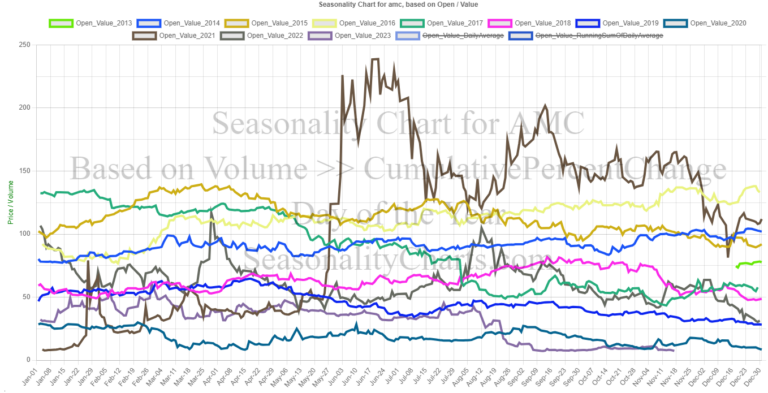
In-Depth Analysis of Daily Seasonality Charts: Beyond Basic Price Data
The world of financial analysis has been revolutionized by the emergence of daily seasonality charts, a tool that has become indispensable for both investors and traders.…
Read the article
Understanding Stock Market Seasonality Charts
In the dynamic world of stock market investing, understanding the rhythm of market trends is crucial. One powerful tool in the investor’s arsenal is the Stock…
Read the articleAll figures are historical averages calculated from daily closing prices. Past seasonal patterns do not predict future results, and nothing on this site is investment advice. See the Disclaimer.