Category Seasonality Charts

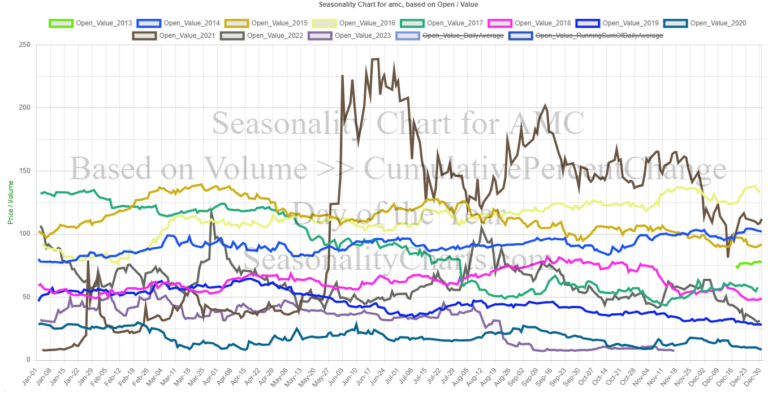
Seasonality Charts is a dedicated category exploring the cyclical patterns in various markets. Our insightful charts reveal how stocks, commodities, and other financial instruments perform across different seasons, offering valuable perspectives for strategic planning and investment decisions. Dive into this category for a visual journey through the rhythms of the markets.

$AMZN Seasonality Charts and Data Table

Historical Daily Percent Change Chart – Stock Market Volatility Analysis This Historical Percent Change Chart tracks the daily percentage fluctuations in stock prices, including Open, High, Low, Close, and Trading Volume. The chart provides a comprehensive view of market volatility,…

$NIO Seasonality Charts and Data Table

Historical Daily Percent Change Chart – Stock Market Volatility Analysis This Historical Percent Change Chart tracks the daily percentage fluctuations in stock prices, including Open, High, Low, Close, and Trading Volume. The chart provides a comprehensive view of market volatility,…