
The world of financial analysis has been revolutionized by the emergence of daily seasonality charts, a tool that has become indispensable for both investors and traders. These charts provide a unique perspective on the daily behavior of assets throughout the year, unveiling patterns that are often obscured in standard analyses. This comprehensive article delves into the essence, creation, and application of daily seasonality charts, underscoring the importance of transcending simple price data.
The Concept of Daily Seasonality Charts
Daily seasonality charts offer a graphical representation that elucidates how an asset’s price typically fluctuates within each day of the year. The process commences with the collection of Open, High, Low, and Close (OHLC) values for each trading day, crucial data points that give insights into the day’s price dynamics.
Data Collection: The Foundation
The journey of crafting a daily seasonality chart starts with meticulous data collection. This involves compiling OHLC values for a specific symbol across several years. The broader the data scope, the more robust the analysis, covering a diverse range of market scenarios. For every calendar day, these values are collated across different years, forming a comprehensive dataset. For example, here is the daily Open Price for $AMC, across the years, since 2013 through 18-Nov-2023, for each day of January.
[table id=1 /]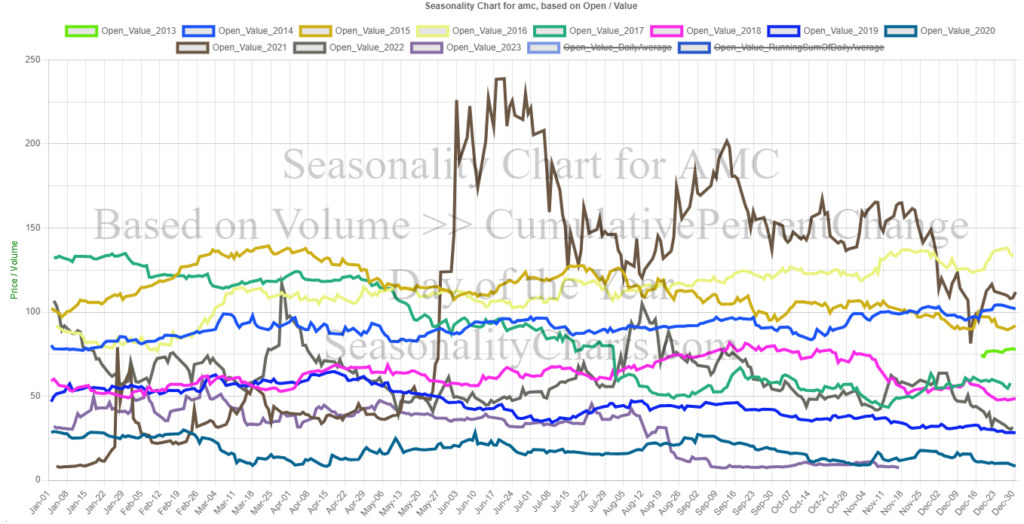
Crafting Daily Averages: A Key Step
The next pivotal step is analyzing the data to identify common patterns for each calendar day. Analysts calculate the daily average for each OHLC value by aggregating the values for each day across all years and dividing by the number of years involved. This process is replicated for every day of the year for each OHLC metric.
Chart Interpretation: Decoding the Patterns
The culmination of this process is a daily seasonality chart that plots these averages over a year. This visualization offers traders and investors a goldmine of information, providing a clear picture of an asset’s typical performance on any given day.
Practical Applications: Where It Shines
Daily seasonality charts are particularly beneficial in markets where seasonal trends have a significant impact, like commodities. In sectors such as agriculture, understanding these trends is vital for making informed trading decisions.
Integrating with Broader Analysis
While daily seasonality charts are insightful, they are most effective when used in conjunction with other forms of analysis, both technical and fundamental. This integrated approach offers a more holistic view of the market.
Limitations: A Word of Caution
It is crucial to acknowledge that past performance is not always indicative of future results. Markets evolve, and historical trends may not always hold true. Additionally, these charts typically do not consider anomalies like market crashes or geopolitical events that can dramatically affect asset prices.
Going Beyond Raw Prices: The Role of Percent Change
Focusing solely on daily OHLC prices of stocks may not yield the depth of insight required for effective market analysis. A more nuanced understanding emerges from examining normalized data, especially the daily percent change and its cumulative sum.
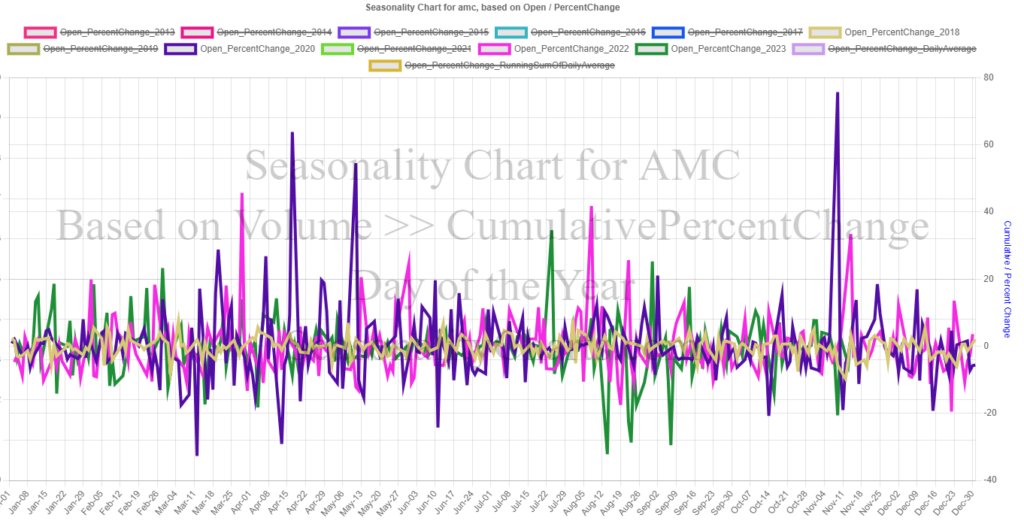
The Daily Percent Change: A Closer Look
The daily percent change offers a more nuanced view than raw price data. It calculates the percentage difference in closing prices from one day to the next, providing a standardized measure of day-to-day value changes. This approach is particularly useful in understanding the relative magnitude of price movements, offering consistency across different stocks or time periods.
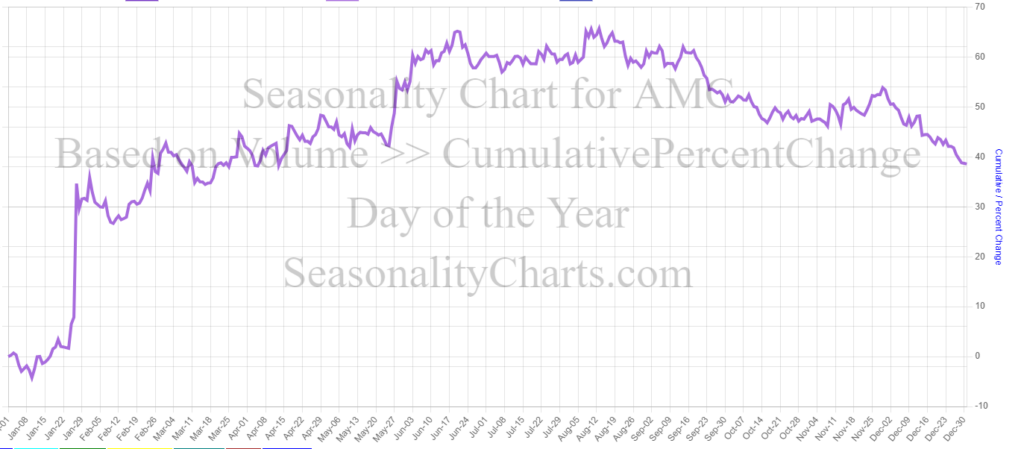
Cumulative Sum: Unveiling the Bigger Picture
The cumulative running sum of percent changes provides a comprehensive perspective, aggregating daily fluctuations to highlight overarching trends and patterns. This broader view is crucial for understanding the long-term impact of market developments on stock prices.
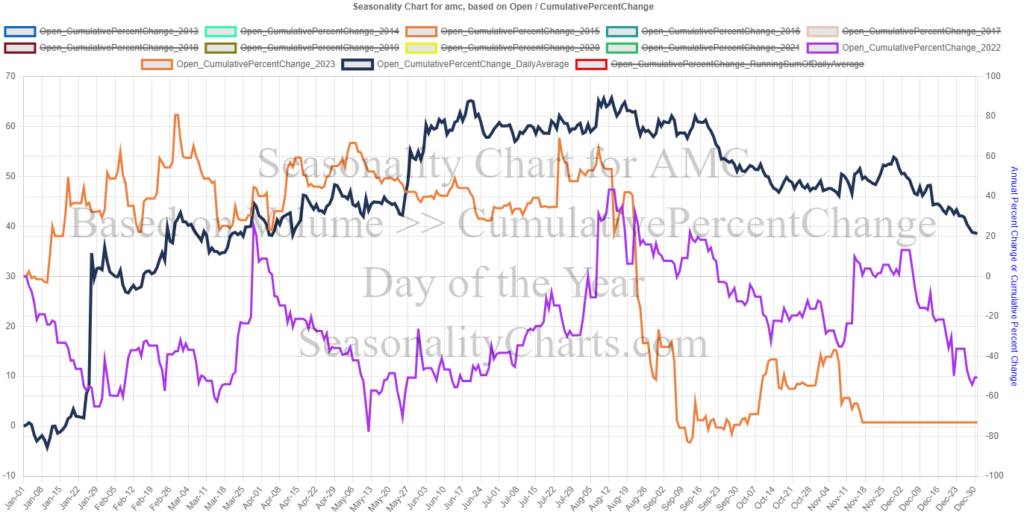
Case Study: Understanding Long-Term Trends
Let’s consider an example, such as the Cumulative Percent Change chart for a $AMC. This chart contrasts different years with the annual Daily Average Cumulative Percent Change, offering a decade-long perspective. Such an analysis reveals not just the average price movements but also the general direction of the stock over an extended period.
Conclusion: Embracing a Comprehensive View
In conclusion, while daily OHLC prices provide a starting point, the real depth of financial analysis lies in the cumulative sum of percent changes. This methodology highlights long-term trends, mitigates the influence of daily market volatility, and supports strategic, data-driven investment decisions. By adopting this comprehensive approach, investors and traders can navigate the complexities of the financial markets with greater clarity and insight.