Loading... Intro to Seasonality Seasonality in stock market, and $MSFT, data refers to recurring patterns and trends that occur at specific times of the year, typically driven by factors such as weather, holidays, or economic cycles. Seasonality Charts and Tables are invaluable tools for investors and traders seeking to identify and leverage these predictable … [Read more...] about Seasonality Analysis for Microsoft ($MSFT)
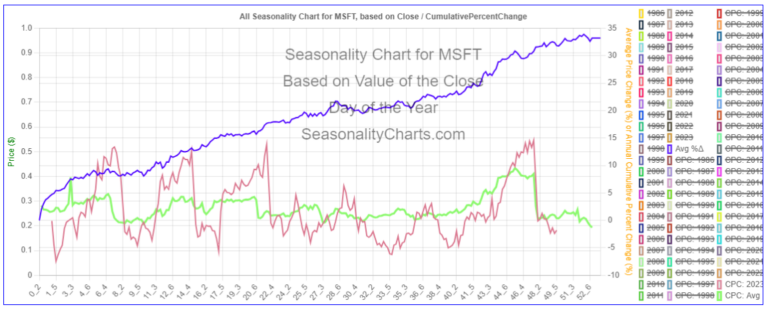
Chart Academy: Mastering Market Analysis
Welcome to Chart Academy, where we transform beginners into market maestros. Dive into our interactive lessons, tutorials, and expert insights designed to elevate your understanding of market charts. From basic interpretations to advanced analytical techniques, Chart Academy is your go-to resource for mastering the art of market analysis.
Seasonality Chart for $NVDA
Loading... Seasonality in stock market data refers to recurring patterns and trends that occur at specific times of the year, typically driven by factors such as weather, holidays, or economic cycles. Seasonality Charts and Tables are invaluable tools for investors and traders seeking to identify and leverage these predictable fluctuations. There are several … [Read more...] about Seasonality Chart for $NVDA
Seasonality Analysis for $GOOGL
Loading... Seasonality in stock market data refers to recurring patterns and trends that occur at specific times of the year, typically driven by factors such as weather, holidays, or economic cycles. Seasonality Charts and Tables are invaluable tools for investors and traders seeking to identify and leverage these predictable fluctuations. There are several … [Read more...] about Seasonality Analysis for $GOOGL
Seasonality Analysis for Tesla ($TSLA)
Loading... Intro to Seasonality Seasonality in stock market, and $TSLA, data refers to recurring patterns and trends that occur at specific times of the year, typically driven by factors such as weather, holidays, or economic cycles. Seasonality Charts and Tables are invaluable tools for investors and traders seeking to identify and leverage these predictable … [Read more...] about Seasonality Analysis for Tesla ($TSLA)
Seasonality Chart for $AMZN
Loading... Seasonality in stock market data refers to recurring patterns and trends that occur at specific times of the year, typically driven by factors such as weather, holidays, or economic cycles. Seasonality Charts and Tables are invaluable tools for investors and traders seeking to identify and leverage these predictable fluctuations. There are several … [Read more...] about Seasonality Chart for $AMZN