Category Seasonality Charts

Seasonality Charts is a dedicated category exploring the cyclical patterns in various markets. Our insightful charts reveal how stocks, commodities, and other financial instruments perform across different seasons, offering valuable perspectives for strategic planning and investment decisions. Dive into this category for a visual journey through the rhythms of the markets.

Seasonality Analysis for $BABA
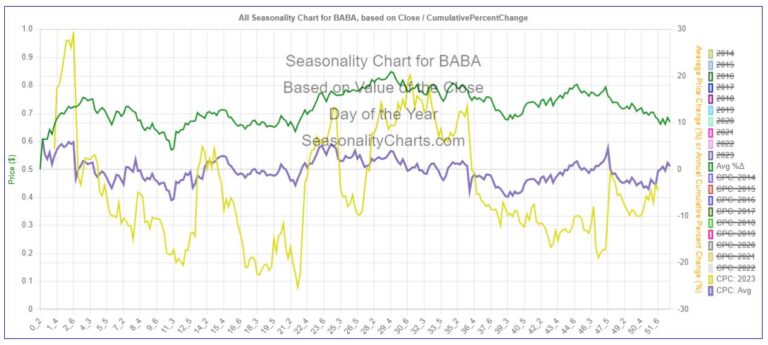
baba seasonality chart

Loading… Seasonality in stock market data refers to recurring patterns and trends that occur at specific times of the year, typically driven by factors such as weather, holidays, or economic cycles. Seasonality Charts and Tables are invaluable tools for investors…

Seasonality Analysis for $UNH

UNH Seasonality Chart

Loading… Seasonality in stock market data refers to recurring patterns and trends that occur at s pecific times of the year, typically driven by factors such as weather, holidays, or economic cycles. Seasonality Charts and Tables are invaluable tools for…

Seasonality Analysis for $META

META Seasonality Chart

Loading… Seasonality in stock market data refers to recurring patterns and trends that occur at specific times of the year, typically driven by factors such as weather, holidays, or economic cycles. Seasonality Charts and Tables are invaluable tools for investors…

Seasonality Analysis for $AAPL

Loading… Seasonality in stock market data refers to recurring patterns and trends that occur at specific times of the year, typically driven by factors such as weather, holidays, or economic cycles. Seasonality Charts and Tables are invaluable tools for investors…