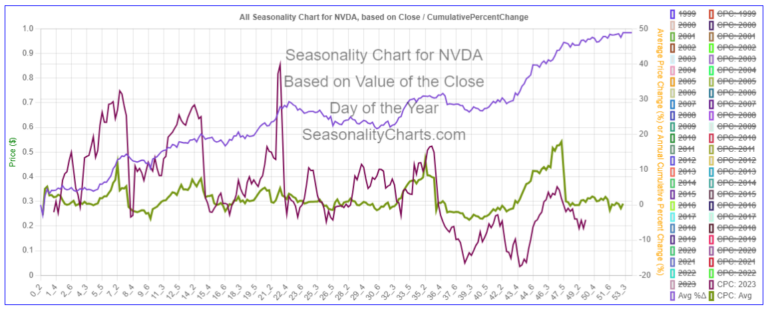
Seasonality Chart for Nvidia ($NVDA)

Seasonality Charts is a dedicated category exploring the cyclical patterns in various markets. Our insightful charts reveal how stocks, commodities, and other financial instruments perform across different seasons, offering valuable perspectives for strategic planning and investment decisions. Dive into this category for a visual journey through the rhythms of the markets.