Tag Investment Strategy

Seasonality Analysis for $META

META Seasonality Chart

Loading… Seasonality in stock market data refers to recurring patterns and trends that occur at specific times of the year, typically driven by factors such as weather, holidays, or economic cycles. Seasonality Charts and Tables are invaluable tools for investors…

Seasonality Analysis for $AAPL

Loading… Seasonality in stock market data refers to recurring patterns and trends that occur at specific times of the year, typically driven by factors such as weather, holidays, or economic cycles. Seasonality Charts and Tables are invaluable tools for investors…

Seasonality Chart for Nvidia ($NVDA)

NVDA Seasonality Chart

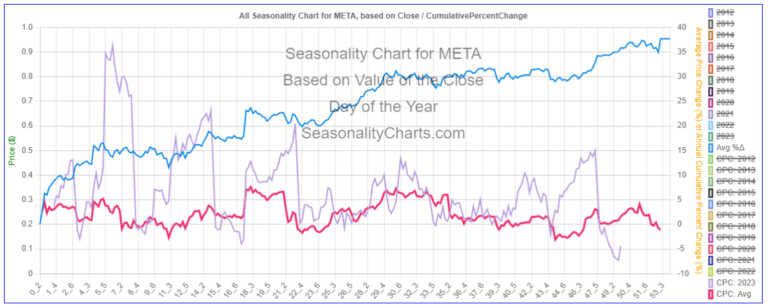
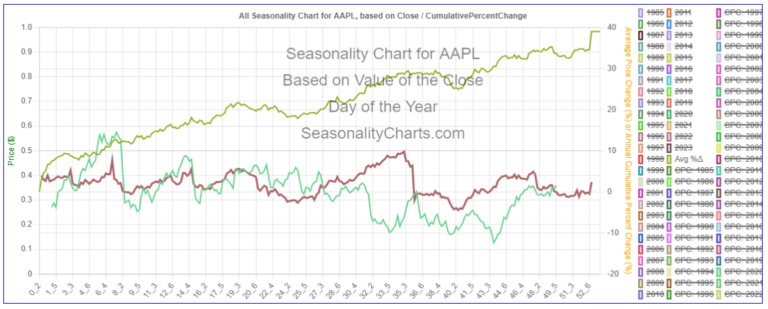
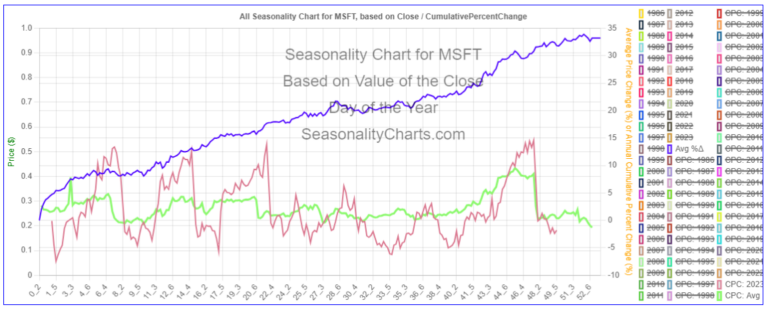
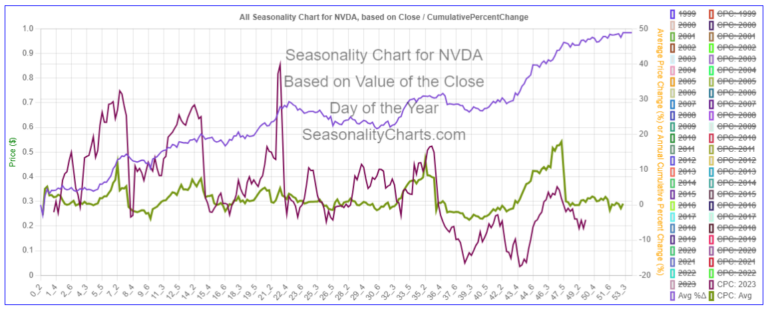
Historical Daily Percent Change Chart – Stock Market Volatility Analysis This Historical Percent Change Chart tracks the daily percentage fluctuations in stock prices, including Open, High, Low, Close, and Trading Volume. The chart provides a comprehensive view of market volatility,…

Seasonality Analysis for $GOOGL

GOOGL Seasonality Chart

Loading… Seasonality in stock market data refers to recurring patterns and trends that occur at specific times of the year, typically driven by factors such as weather, holidays, or economic cycles. Seasonality Charts and Tables are invaluable tools for investors…