
Data studies built from the same daily prices as the symbol pages: which stocks follow the S&P 500’s seasonal pattern, whether markets really move in multi-year cycles, and how sectors such as industrials, gold miners, consumer staples, healthcare, semiconductors, oil, autos and technology behave through those cycles. The charts and tables in each article are live: they update as new data arrives.
Market cycles
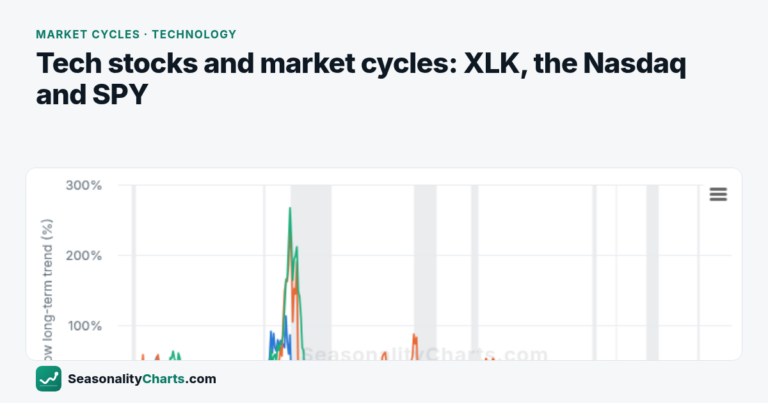
Tech Stocks and Market Cycles: Microsoft, Apple, Cisco and the Nasdaq vs XLK and the S&P 500
Tech stocks swing hard but irregularly. We compare Microsoft, Apple, Cisco, IBM and Oracle with XLK, the Nasdaq Composite and SPY through every major drawdown.
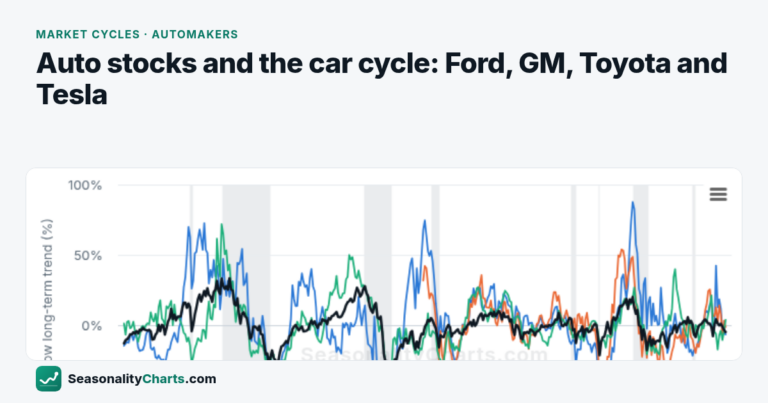
Auto Stocks and the Car Cycle: Ford, GM, Toyota and Tesla vs Consumer Discretionary (XLY) and the S&P 500
Ford has one of the clearer multi-year cycles on the site. We compare Ford, General Motors, Toyota and Tesla with the consumer discretionary fund XLY and with SPY.
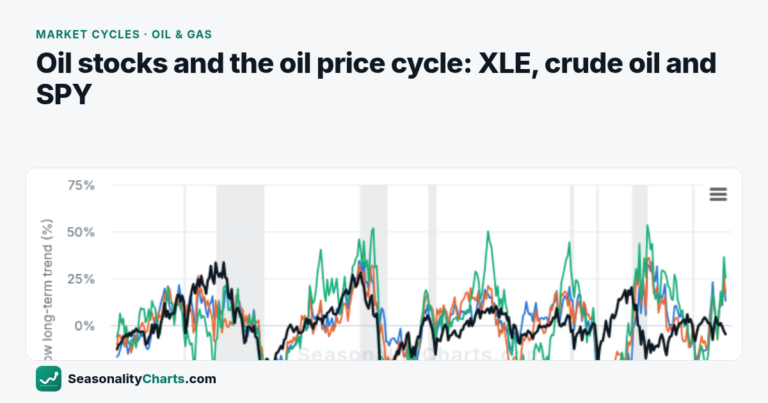
Oil Stocks and the Oil Price Cycle: Exxon, Chevron, ConocoPhillips and SLB vs XLE, Crude Oil and the S&P 500
Oil stocks follow crude oil's boom-and-bust cycle more than the stock market's. We compare Exxon Mobil, Chevron, ConocoPhillips, EOG and SLB with XLE, crude oil and SPY.
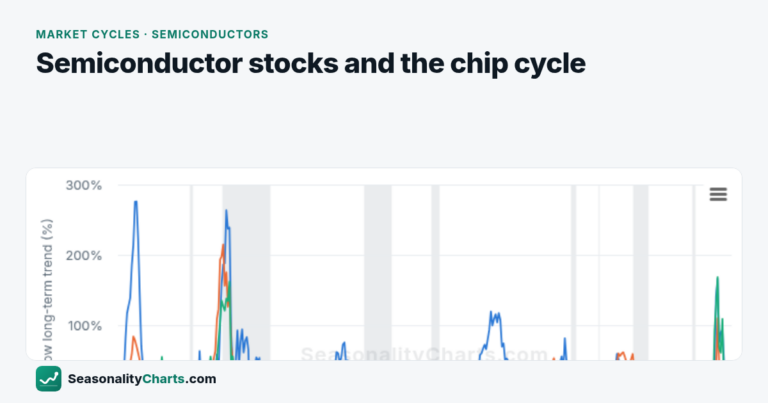
Semiconductor Stocks and the Chip Cycle: Micron, Applied Materials, Intel and Nvidia vs SMH and the S&P 500
Chip stocks are intensely cyclical but irregular. We compare Micron, Applied Materials, Intel, Nvidia and Texas Instruments with SMH and SPY through every boom and bust.
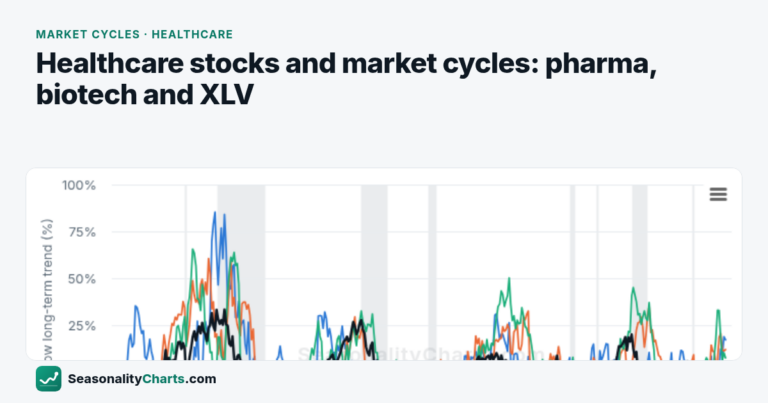
Healthcare Stocks and Market Cycles: Amgen, Bristol-Myers, CVS and J&J vs XLV and the S&P 500
The healthcare sector fund XLV has a slow 7.8-year cycle. We compare Amgen, Bristol-Myers Squibb, CVS, Johnson & Johnson and Vertex with XLV and SPY through every major drawdown.
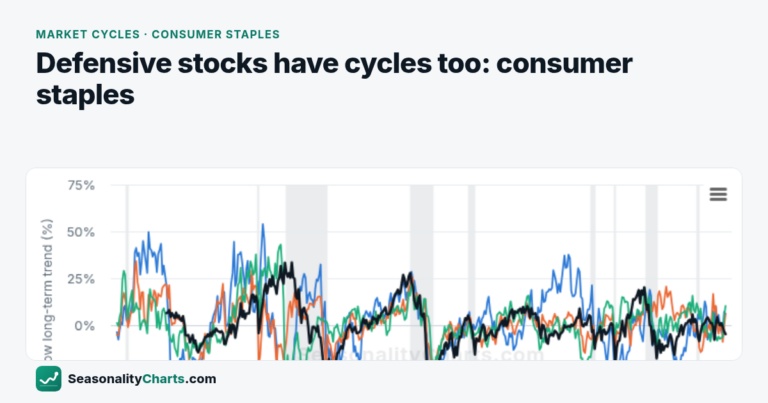
Defensive Stocks Have Cycles Too: Consumer Staples’ 5- to 8-Year Waves (Altria, PepsiCo, P&G vs XLP and SPY)
Consumer staples have the highest share of measurable multi-year cycles of any sector. We compare Altria, PepsiCo, Procter & Gamble, Kimberly-Clark and others with XLP and SPY.
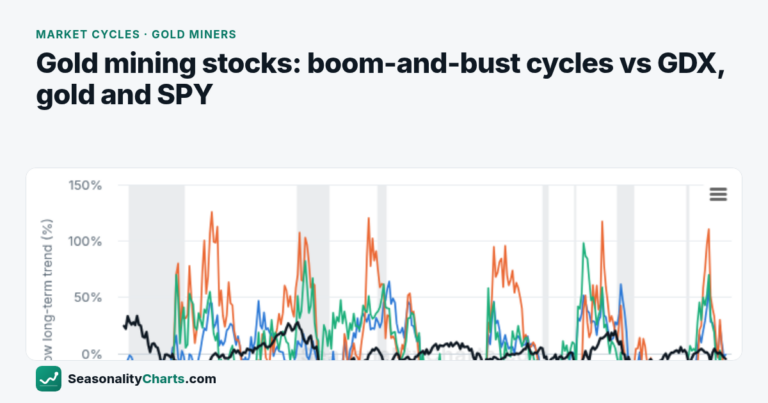
Gold Mining Stocks: Boom-and-Bust Cycles of Newmont, Hecla, Kinross and Wheaton vs GDX, Gold and the S&P 500
Gold and silver miners have the largest regular cycles of any group we tested. We compare Newmont, Hecla, Kinross, Wheaton and Agnico Eagle with GDX, gold and SPY.
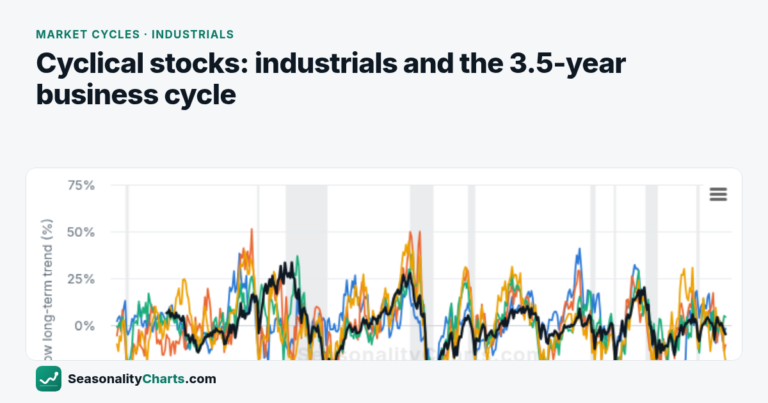
Cyclical Stocks: Industrials and the 3.5-Year Business Cycle (3M, Parker-Hannifin, Emerson, Eaton vs XLI and SPY)
3M, Parker-Hannifin, Emerson and Eaton share the market's 3.5-year business-cycle rhythm. We compare their cycles and drawdowns with the industrial sector fund XLI and with SPY.
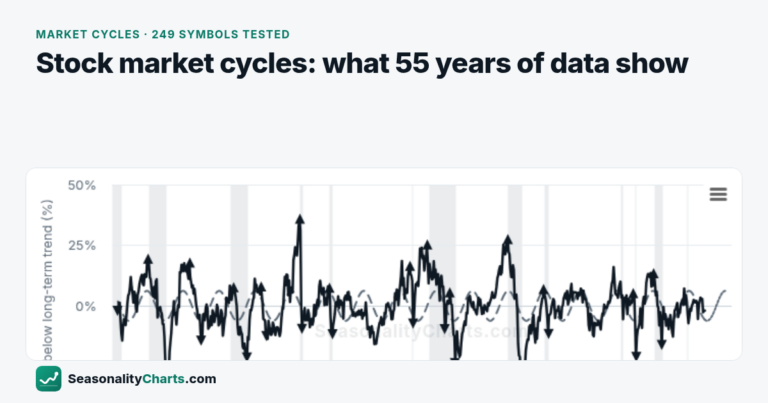
Stock Market Cycles: Do Stocks Really Move in 3-, 4- and 7-Year Cycles? We Tested 249 Symbols
We tested 249 stocks, ETFs and indexes for repeating multi-year cycles. The Dow follows a 3.5-year rhythm close to the Kitchin cycle, SPY a 7-year wave, the presidential election cycle…
Seasonality studies
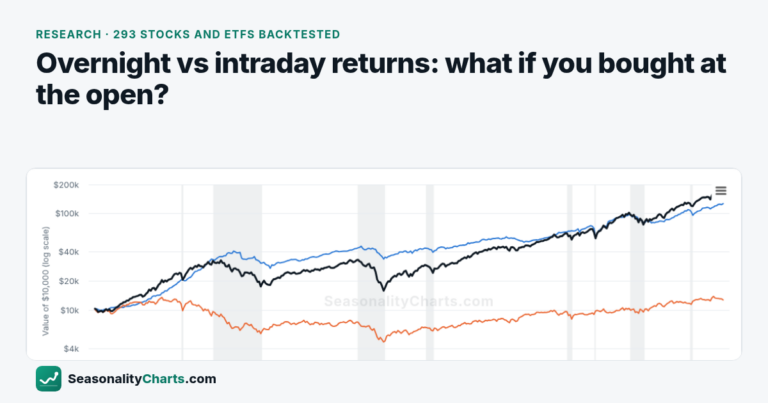
What If You Bought at the Open? Overnight vs Intraday Returns and Seasonal Timing, Tested on 293 Stocks and ETFs
We tested seven buy-and-sell rules and three seasonal-signal rules on every stock, ETF and index with reliable opening prices. Most gains came overnight, periodic rules came close to buy and…
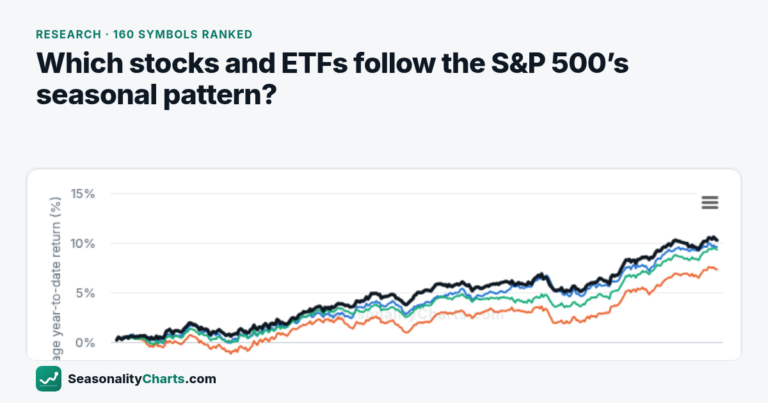
Which Stocks and ETFs Follow the S&P 500’s Seasonal Pattern? We Ranked 160 Symbols
We compared the seasonal pattern of 160 stocks, ETFs and indexes with SPY over the same years. Industrials and big banks follow the S&P 500’s calendar most closely; Treasuries, the…
Guides
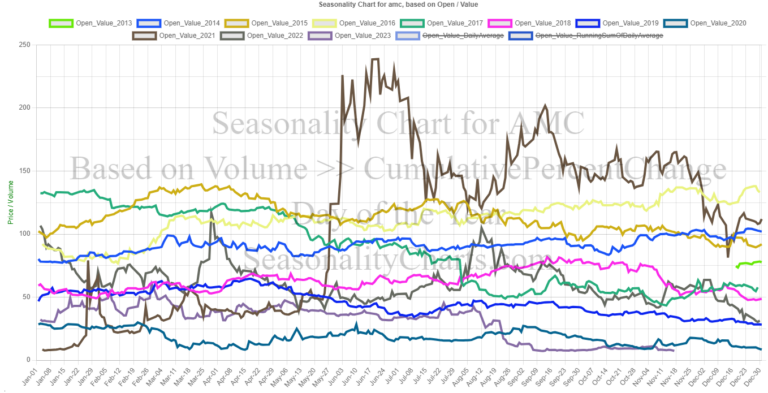
In-Depth Analysis of Daily Seasonality Charts: Beyond Basic Price Data
The world of financial analysis has been revolutionized by the emergence of daily seasonality charts, a tool that has become indispensable for both investors and traders. These charts provide a…
Understanding Stock Market Seasonality Charts
In the dynamic world of stock market investing, understanding the rhythm of market trends is crucial. One powerful tool in the investor’s arsenal is the Stock Market Seasonality Chart. These…